Setting the Scene
You are responsible for a multi-year funding proposal. A program officer asks: what is your wage line for the next five years? There is no simple answer. You know there are multiple factors: minimum wage changes, living wage adjustments, market pressures. If you aim too low, you underfund your own team, leading to resentment and lack of engagement. Too high and the proposal looks padded. The instinct is to copy last year's number with a small increment, hold your breath, and hope. That is the habit this article is meant to break.
Two of the main benchmarks you are planning against - minimum wage & living wage - are different animals. We’ll explore these below.
Before drafting your next workforce budget, consider three questions:
- If the minimum wage rises another ±15% by 2030, does your lowest pay band still hold its shape?
- Do your current multi-year commitments allow for an automatic annual increase?
- If you are a Living Wage Employer, do you know what sustaining the annual increases will cost you three to five years out?
A Critical Point
A single-number wage forecast is merely a guesstimate. There is no way to know with certainty the future minimum wage, and the living wage is even less predictable. The goal here is not to pin down the number; it is to mitigate the risk it creates, whether that risk sits in a funding envelope, an operating budget, or the operating costs you are trying to hold steady. Funders, boards, and finance leads trust a range with stated assumptions far more than a confident number that turns out wrong. A practical approach is to build a defensible range, state what it assumes, and put it to work in your planning.
What Leaders Are Navigating
Two Benchmarks, Two Logics
The minimum wage is largely predictable: since the Employment Standards Act was amended, it rises automatically every June 1, tied to the previous year's average inflation. You will not know the exact figure until the late-February announcement each year, but you can model it within a narrow band because it follows the Consumer Price Index (CPI).
The living wage is more unpredictable. The 2025 Metro Vancouver living wage is calculated from the cost of housing, food, childcare, and transportation. It is not indexed to anything, and as the next section shows, it does not move in a straight line.
BC Inflation & CPI, 2015–2030
Two Wages, Two Histories
To see why the two benchmarks need different treatment, look at the last decade. They tell very different stories.
Swipe to see more →
| Year | Min. wage | Living wage | What happened |
|---|---|---|---|
| 2019 | $13.85 | $19.50 | Closest-ever gap; MSP premiums end, childcare benefit arrives |
| 2022 | $15.65 | $24.08 | Living wage jumps 17% — largest on record; housing and food costs surge |
| 2025 | $17.85 | $27.85 | Gap reaches $10/hr for the first time |
| 2026 | $18.25 | Pending (Nov 2026) | Min. wage +2.2% June 1; living wage announced Nov 2026 |
The Number to Budget
If you take one number from this article, take a range, not a rate. As a planning assumption based on the last decade of CPI-linked increases — not a recommendation for every employer — organizations that follow the minimum wage should model roughly 2.5% annual wage growth, and Living Wage Employers roughly 3.2%.
One thing these figures are not: a rate to apply identically every year. They are averages across the planning horizon. The actual sequence will vary — a real decade might run 3.0%, then 4.1%, then 2.2% — because the minimum wage follows the prior year's inflation and the living wage follows costs. What you hold constant is the average over the multi-year plan, refreshed against the announced figures each February and November; what you expect to move is the individual year.
The Three Scenario Bands
Extend each benchmark as three bands — conservative, central, and aggressive — with the assumption named out loud so a board or funder can see exactly what you are betting on. The table below shows the central band.
Swipe to see more →
| Year | ~Min. wage (central) | ~Living wage (central) |
|---|---|---|
| 2027 | $18.71 | $29.83 |
| 2028 | $19.18 | $30.88 |
| 2029 | $19.66 | $31.96 |
| 2030 | $20.15 | $33.08 |
By 2030 the minimum wage lands near $20.15 and the living wage near $33, a wider spread because housing costs are harder to call and, as 2022 showed, capable of a double-digit jump in a single year. If you are outside Metro Vancouver, rebuild the living-wage column for your community — Living Wage BC publishes rates for more than two dozen regions.
Wage Compression: The Cost Nobody Budgets
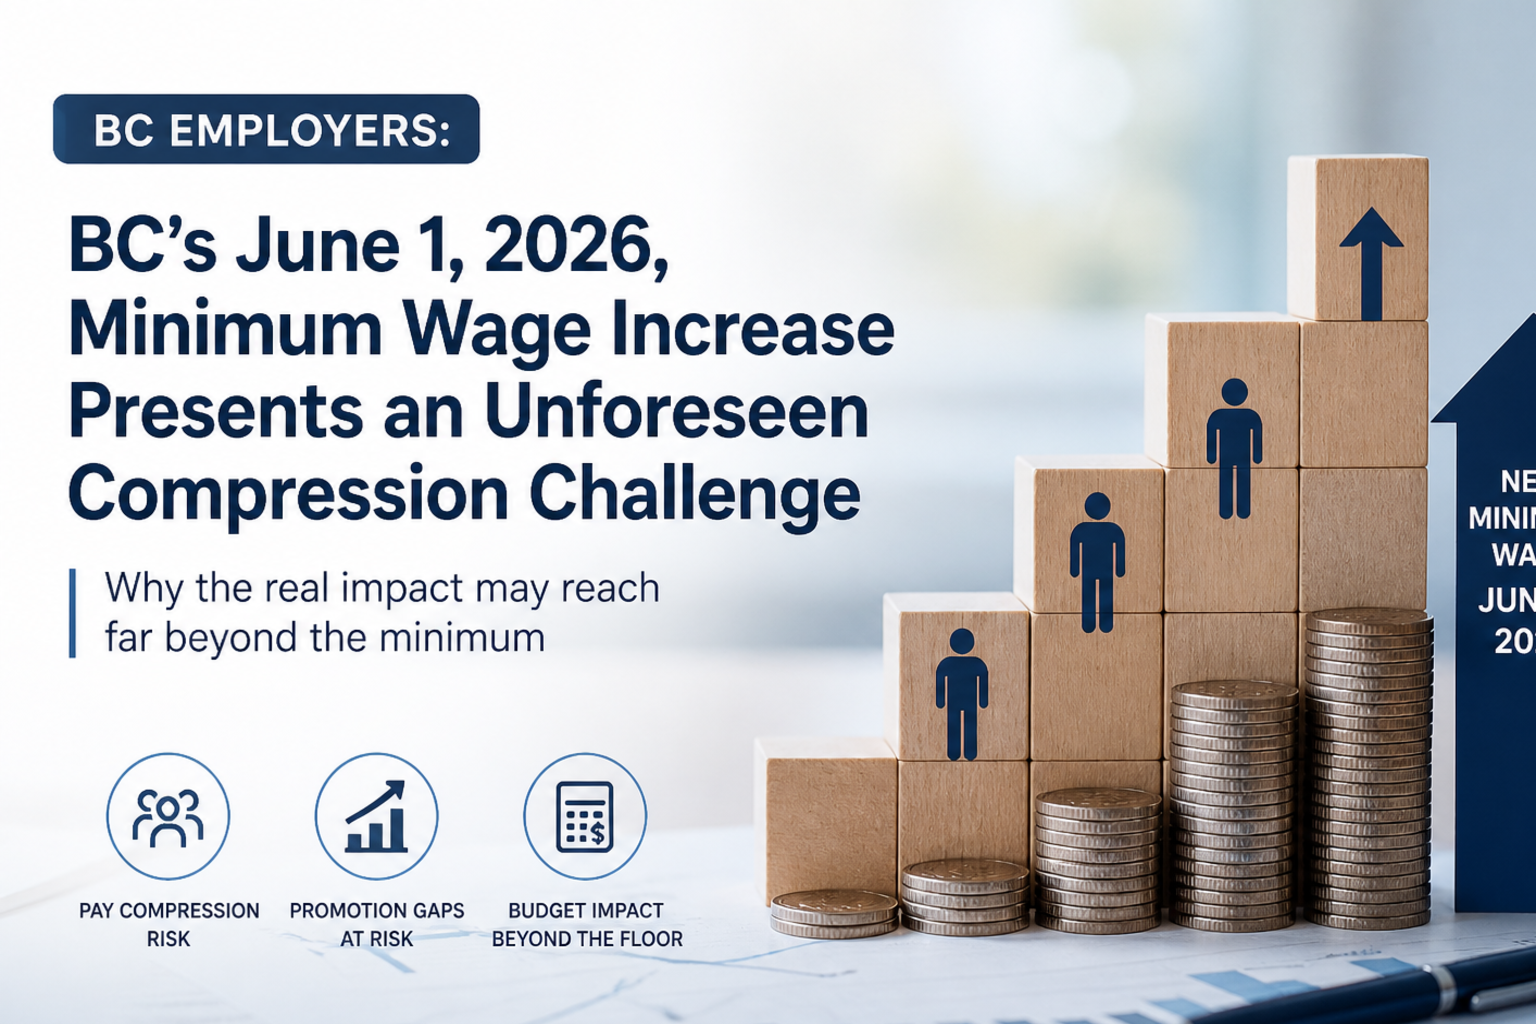
Even if your wage projections are accurate, one cost is often overlooked: wage compression. Every increase to the wage floor affects more than the employees at that floor (the Domino effect). As a practical planning assumption, budget a ripple of 40–60% of the floor increase through the next pay band, tapering above—or consciously accept that pay differentials will narrow. Under BC's pay transparency rules, those narrowing differentials are increasingly visible in posted salary ranges. This article focuses on budgeting for the increase itself. For practical guidance on managing the ripple effects, see our minimum wage & compression insight. If the increases require broader changes to your compensation framework, our Total Rewards Strategy service is the logical next step.
The Living Wage Choice
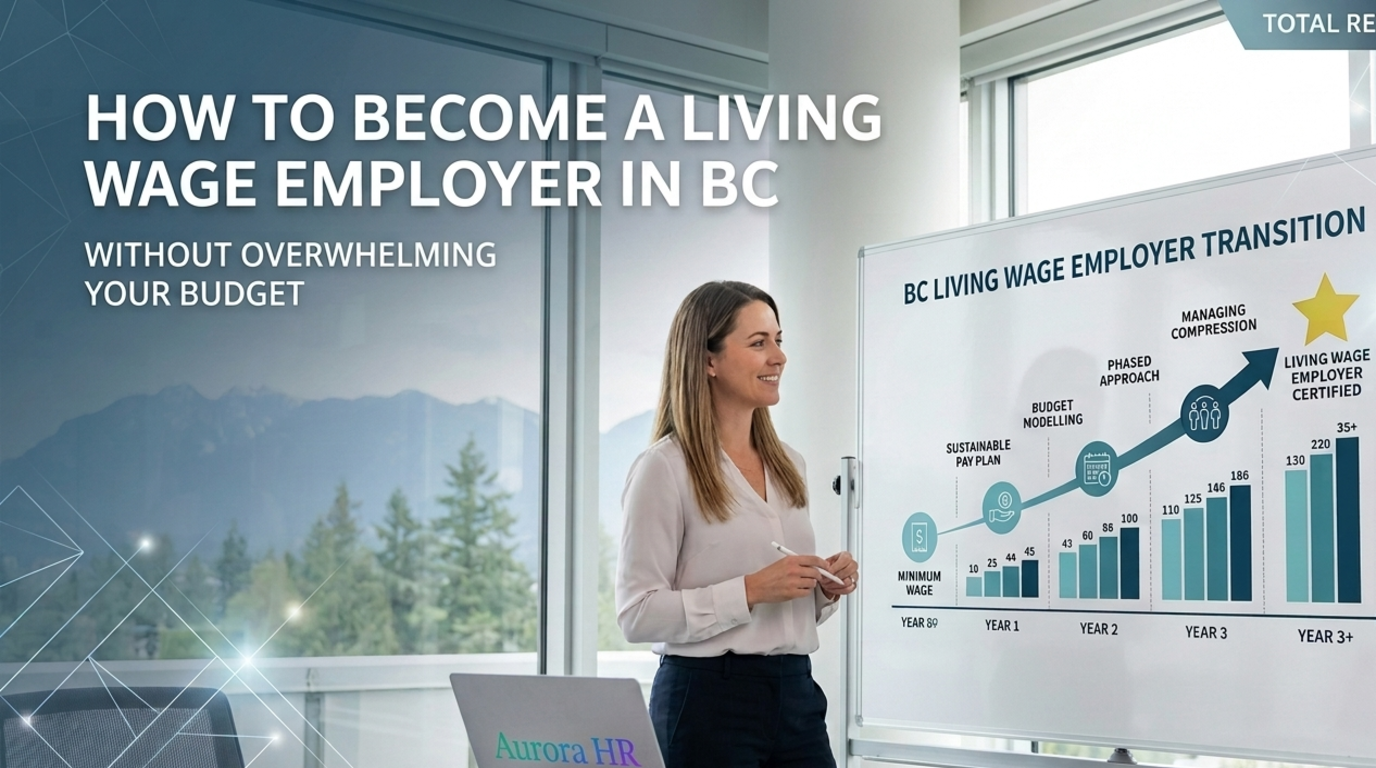
Organizations that hold up the living wage as a value have three honest postures. Commit — certify and budget the November increase as a standing line (see how to become a certified Living Wage Employer without breaking your budget). Aspire with a glide path — publish interim steps (“within $2.00 by 2028, certified by 2030”) with a dollar figure and a date against each; this matters most for the roles behind BC's gender pay gap, which the drift position quietly widens. Decline with a philosophy — legitimate when the math doesn't work, provided staff can read a stated compensation philosophy they can point to.
The Only Wrong Path: Drift
Holding the living wage up in public statements with no budget line, no glide path, and no acknowledgement of the gap to staff. Employees see through this faster than leaders expect. The drift position loses trust without saving money, and it is the one position to avoid.
Key Actions: The Multi-Year Planning Checklist
- Build the scenarios once. Three bands for each wage through 2030.
- Refresh twice a year. February for the minimum wage, November for the living wage. Neither lands on a fiscal boundary, which is why they get missed.
- Lock in the central case. Use it in your next funding proposal or operating budget, with the conservative case as the floor and the aggressive as the stress test.
- Build in an annual increase. In every multi-year funding agreement or operating plan, an average annual increase of 2.5%–3.5% across the term is defensible and documentable — individual years will vary with the announced figures.
- Audit locked agreements. Flag any funding agreement or budget locked at today's wage levels through 2028 or beyond. Those are the budget emergencies.
- Choose your living-wage path. Commit, aspire with a glide path, or decline with a philosophy — and document the choice.
Aurora's Perspective
Most workforce budgets are built on a single forecast that assumes tomorrow will look much like today. Aurora takes a different approach. We help BC organizations build workforce budgets that remain credible as assumptions change by distinguishing between predictable drivers, such as CPI-linked minimum wage increases, and less predictable pressures, such as living wage adjustments and labour market conditions.
The result is a workforce budget your board, funder, or leadership team can understand, defend, and update as conditions change rather than rewriting the plan every time assumptions shift.
This insight provides general planning guidance for BC employers and is not legal or financial advice. Wage rates, indexing rules, and Living Wage BC methodology can change; verify the current figures with the Government of BC and Living Wage BC before relying on them for a budget.
Build Your Workforce Budget Scenario Model
If you are writing a multi-year budget or funding proposal now, this is the work to do before your board approves the numbers. Aurora builds the scenario model with you and makes sure the annual increase is written into your agreements before they are signed.
Book a consult